How to calculate effect size in Excel (2 Ways)
In this article, you will learn how to calculate effect size in Excel. To do that, First, you need to input the mean weight of two groups and the standard deviation into an Excel sheet and insert the formula (θ = (μ1 – μ2) / σ) when the mean weight and standard deviation are given. If the mean and the SD are not given, you need to calculate that first and calculate the effect size in Excel.
Effect Size Formula and How Effect Size Works
So, here is what we need to know to calculate the effect size in Excel.
The general formula is
θ = (μ1 – μ2) / σ
Here,
- θ means the “effect size” which we want to know.
- μ1 means the “Mean” of the 1st population/group.
- μ2 means the “Mean” 2nd population/group.
- σ means “Standard Deviation.”
This formula is also called Cohen’s d.
Now, if we have the mean and standard deviation for the data, we can easily calculate the effect size in Excel. But if we only have group data, how will we know the mean and standard deviation?
Well, we’ll learn about this in example 2.
How to calculate effect size in Excel: With Mean and Standard Deviation
In this example, we will learn how to calculate effect size when the mean and Standard deviation are given.
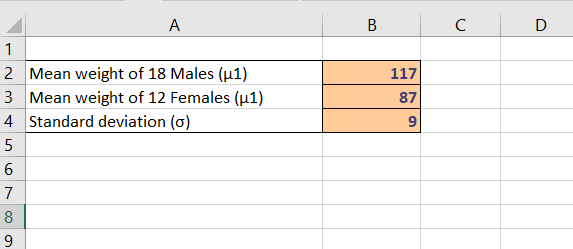
For example, an office comprises 18 male and 12 female workers. Now, we want to calculate the effect size of the weight of these two groups,
- Where the mean weight of the 18 males is 117 lbs, and the mean weight of the 10 females is 87 lbs.
- The standard deviation is 9 lbs.
Now, we will see how to calculate the effect size in Excel in three simple steps.
Step 1: Put the data in Excel.
Here, we put
- The mean weight of the 18 males (117), which is μ1, is in cell B2
- The mean weight of the 12 females (97), which is μ2, is in cell B3
- And standard deviation (9) in cell B4.
Step 2: Put the formula into work.
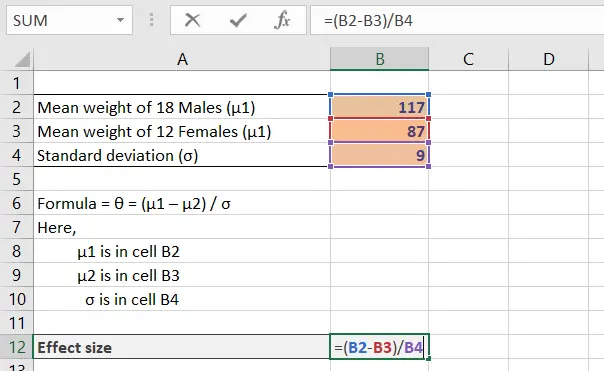
As we know, the formula for effect size is
θ = (μ1 – μ2) / σ
Now, to calculate, we need to subtract B3 from B2 and divide the result by B4 here, which is how we refer to the cell in the sheet.
θ= (117 lbs – 87 lbs) / 9 lbs
θ= (B2 – B3) / B4
Step 3: Result!
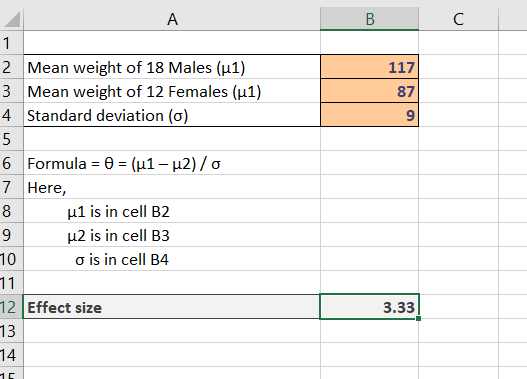
After putting the formula into work, press ENTER, and voila! You get your result.
θ= 3.33
So, we can see that the effect size for these two groups is 3.33.
We’ll know more about how to interpret these results later.
How to calculate effect size in Excel: When Mean and Standard Deviation Are Not Given
In this example, we will learn how to calculate effect size when the mean and Standard deviation are not given.
So, we need to calculate the mean for each group and the standard deviation first.
Let’s look at our data set first.
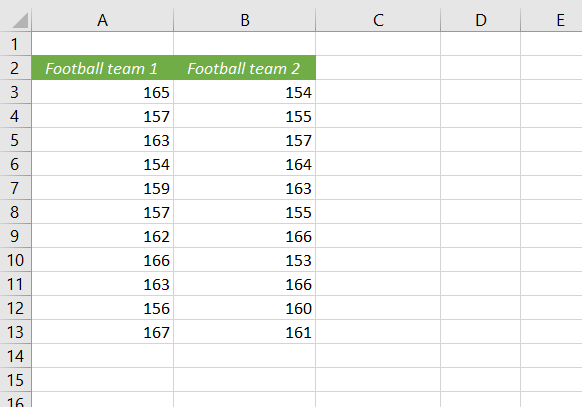
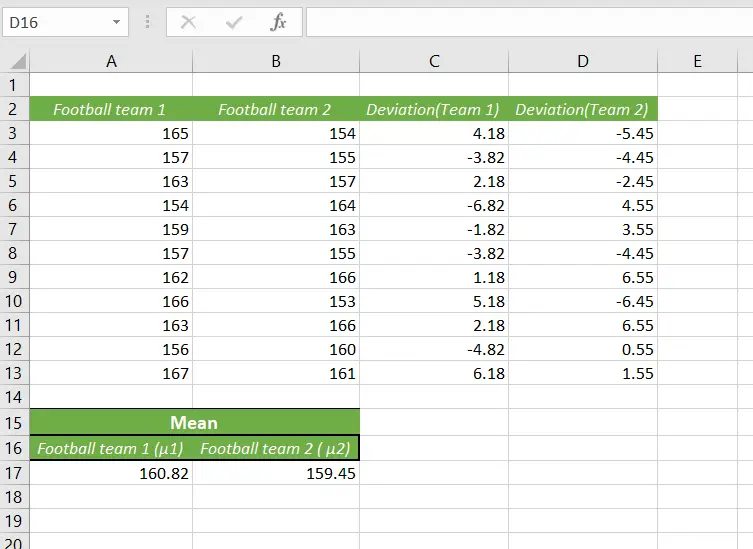
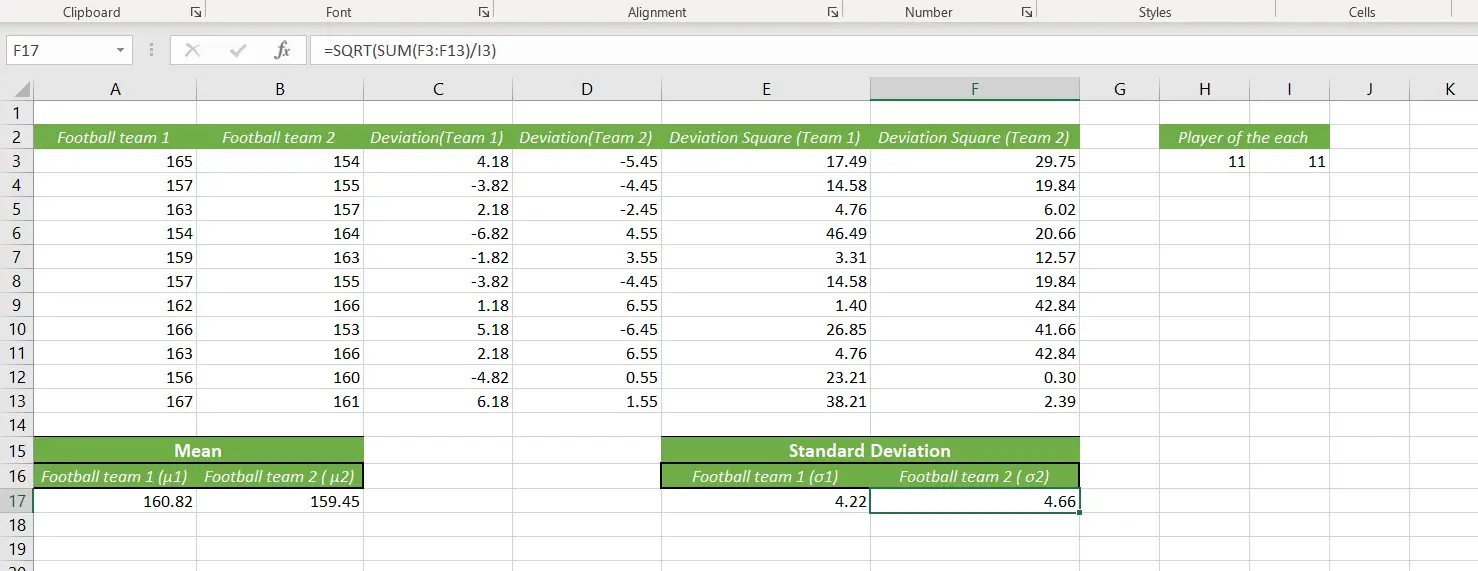
Here, we have two football teams, which contain 11 players each. Now, their height is given, and we want to know the effect size of this data set.
Step 1: Calculate the mean for each group of data.
Mean basically refers to the average of the data set of a group. So, we can easily calculate this using the AVERAGE function in Excel.
So, the mean will be for each group,
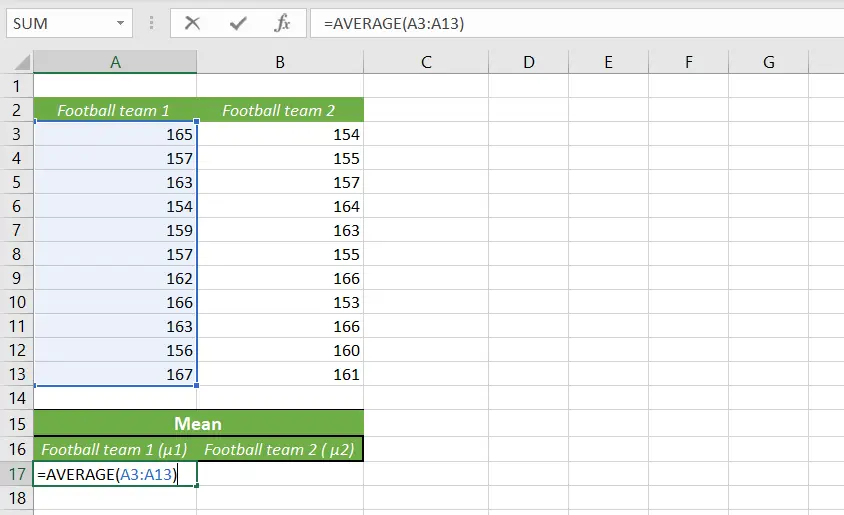
In cell A17, we put the average function for football team 1, which is our mean (μ1) for this group.
In the same way, we can calculate the mean for group 2. Just drag the fill handle to the right cell, which is B17, and we’ll get out the mean for football team 2, which is μ2.
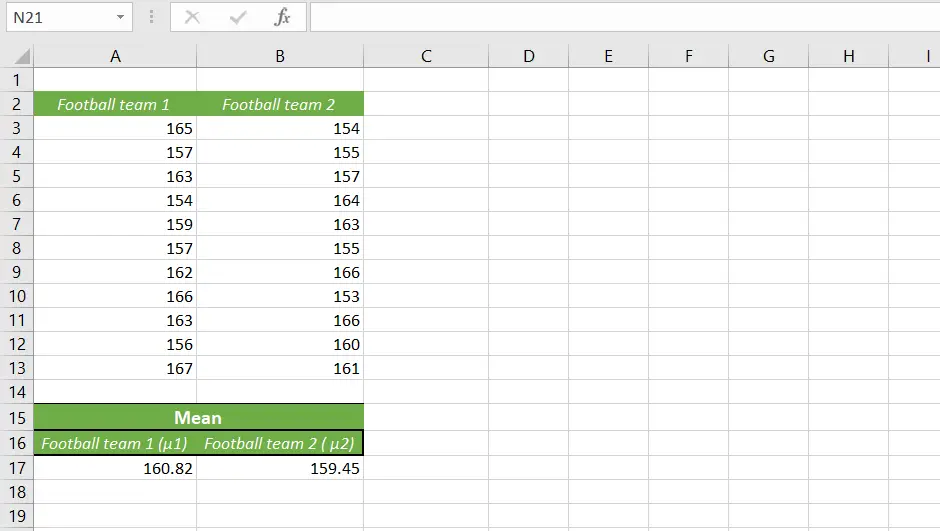
Now, we have our,
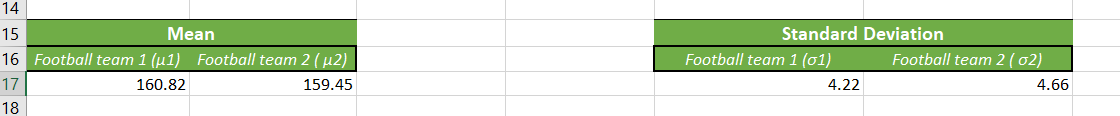
- The mean of football team 1 (μ1) = 160.82
- The mean of football team 2 (μ2) = 159.45
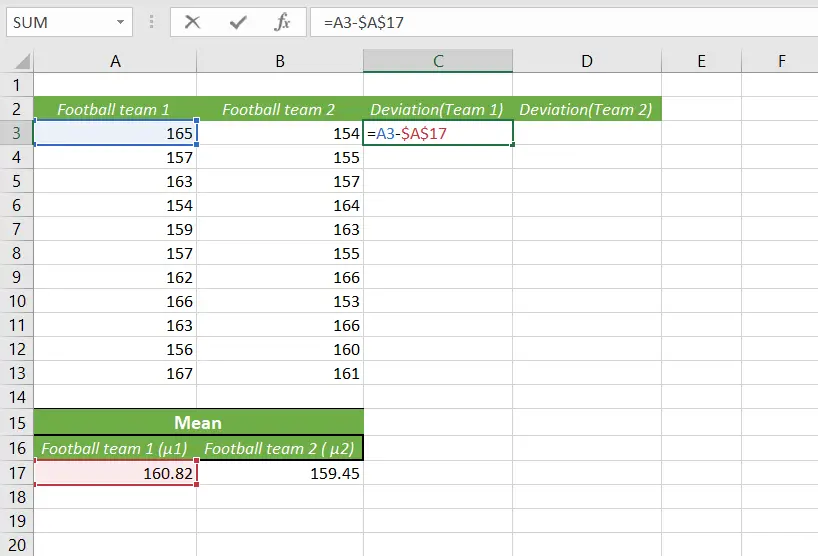
Step 2: Calculate the deviation
In order to calculate the deviation, we need to subtract the mean of each group from each player’s data. So, the formula will be the data of the player from team 1 – the mean of team 1.
In cell C3, it will be =A3-$A$17.
Don’t forget to use the absolute cell referencing for the Mean because we’re using it for every data in the column.
To fill up all of the data for other players, just use the fill handle.
So now, we have the deviation for Team 1.
We can calculate the deviation for team 2 in the same way.
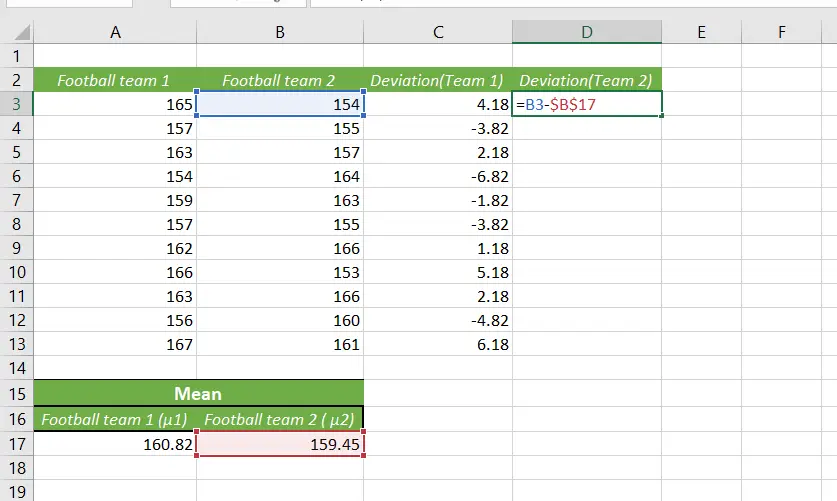
Just subtract the mean of team 2 from the data of the players from the same team.
Now that we have our deviation, we can move to the next part, which is calculating the deviation square.
Just select the first data from the column and square that data like this,
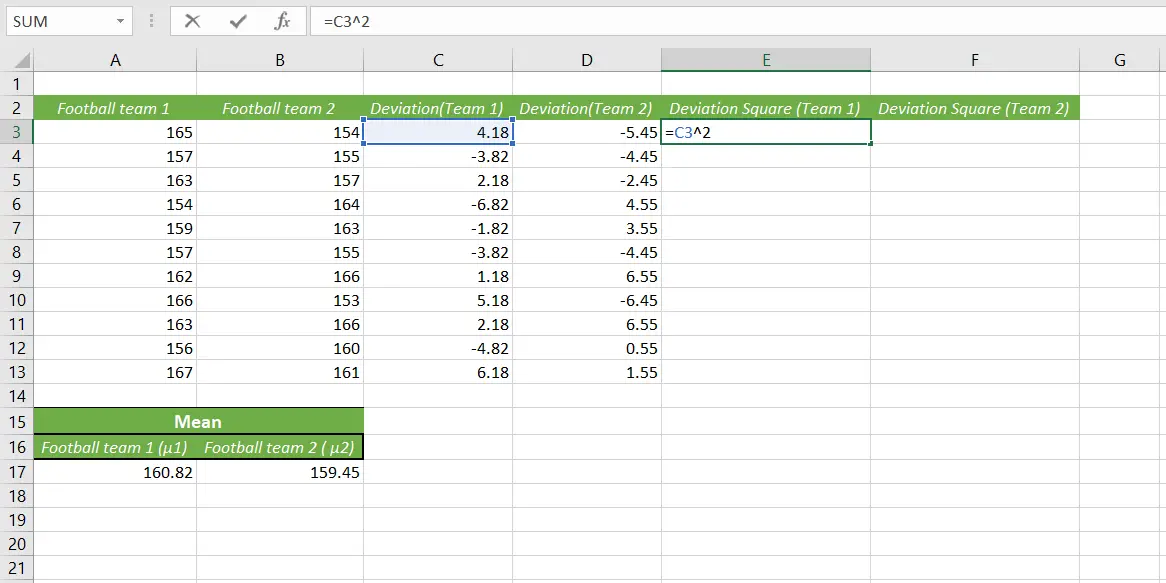
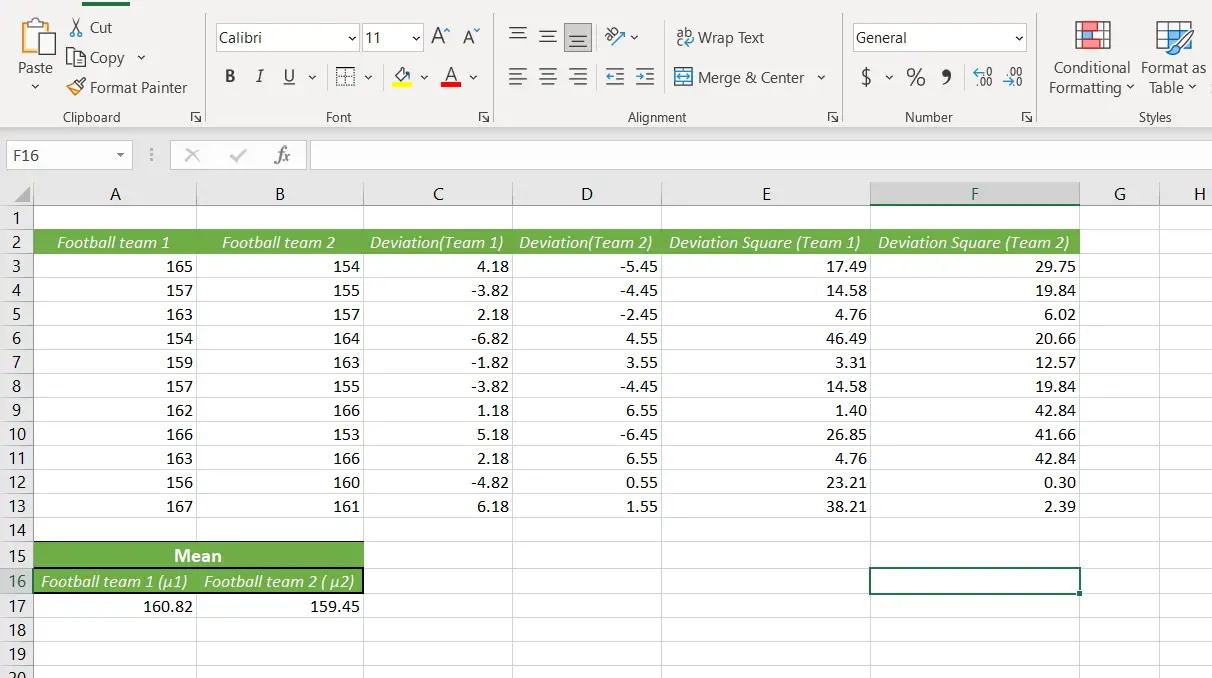
Use the fill handle to calculate the data in the column and for team 2 too. After that, the data set will look like this.
Now, we are going to calculate the standard deviation by using this data.
When it comes to calculating the standard deviation, we need the SQRT formula, which returns the square root of a number.
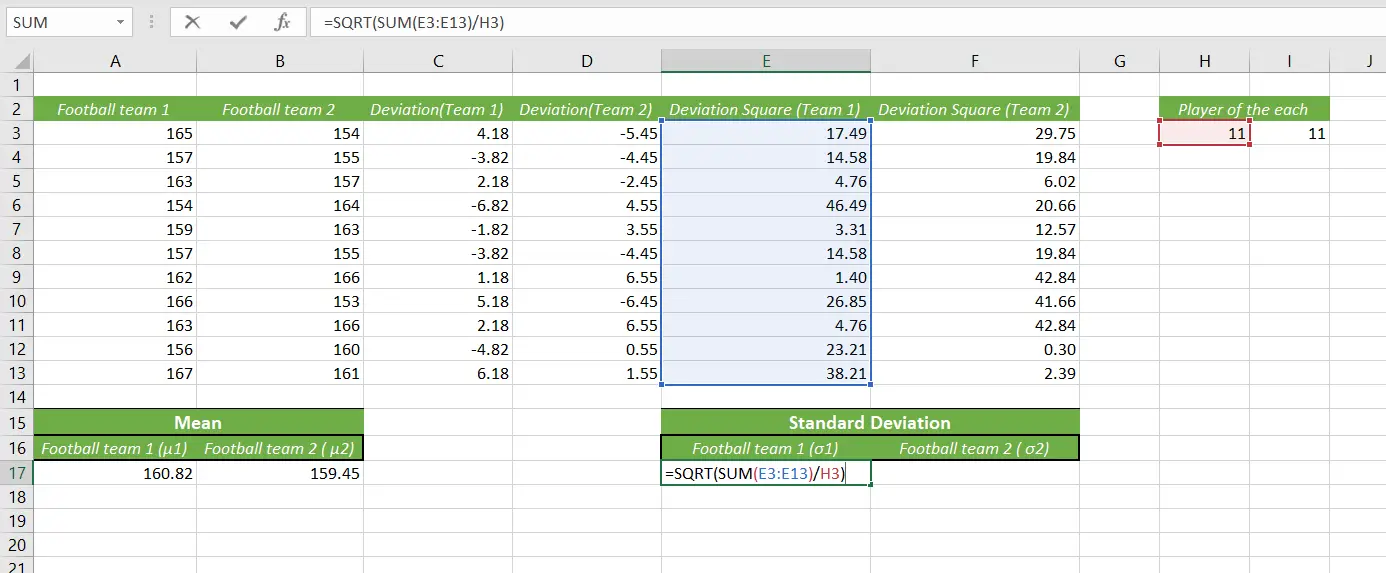
So, the formula will be, =SQRT(SUM(E3:E13)/H3)
Here, we SUM the data of team 1 and divide it by H3.
[Quick note: In the H3 cell, we used the COUNT formula to know how many players are in each team. The COUNT formula is used for calculating for many data in a range selected ]
And we have our result for standard deviation. In the same way, we can calculate the standard deviation for team 2.
So we get,
- Standard Deviation for team 1 (σ1) = 4.22
- Standard Deviation for team 2 (σ2) = 4.66
[You can skip this part]
Another thing is we would’ve calculated pooled SD if it were required by using a formula that is a bit complex, so we used the method we used previously.
The formula is, =SQRT(((n1-1)*SD1^2+(n2-1)*SD2^2)/(n1+n2-2))
SD1 – SD of team 1
SD2 – SD of team 2
n1 – No of player in team 1
n2 – No of player in team 1
Step 3: Calculate effect size
From steps 1 and 2, we have our data which is,
- The mean of football team 1 (μ1) = 160.82
- The mean of football team 2 (μ2) = 159.45
And,
- Standard Deviation for team 1 (σ1) = 4.22
- Standard Deviation for team 2 (σ2) = 4.66
As we know, for calculating effect size, we used the formula which is,
θ = (μ1 – μ2) / σ
We can use this data to calculate the effect size for each group.
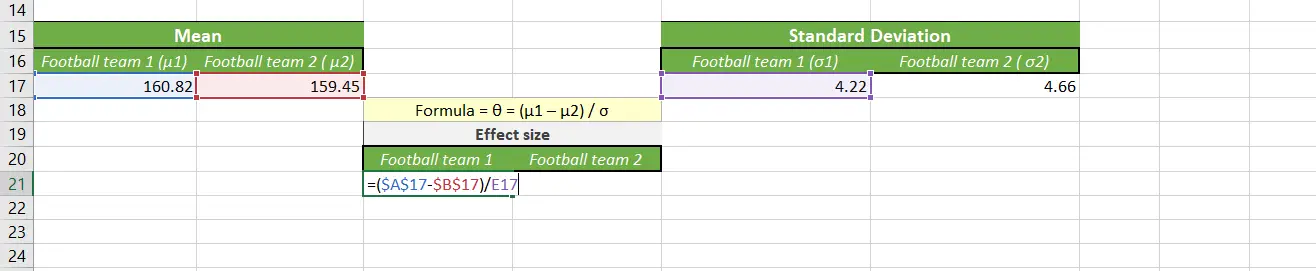
Here, we subtract the μ2 from μ1 and divide it by the SD of team 1.
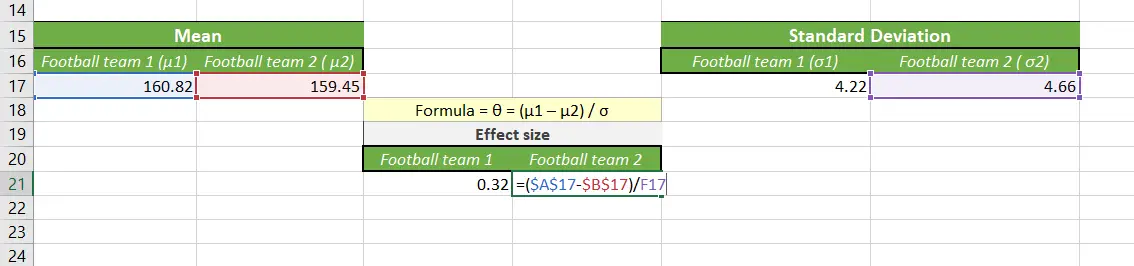
By using the same formula, we get the result for team 2.
If we want to relate to the formula,
= (μ1 – μ2) / σ
=($A$17-$B$17)/E17
Here, μ1 is in A17, and μ2 is in B17. so we subtracted it and divided it by each SD from each team.
After calculating, we get the effect size,
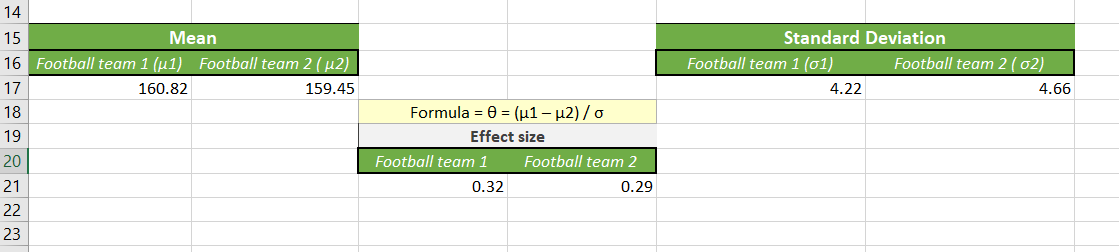
- Football team 1 (θ1) = (160.82 – 159.45) / 4.22
- Football team 2 (θ2) = (160.82 – 159.45) / 4.66
So, we can see that the effect size for team 1 is 4.22, and for team 2, it is 4.66.

Hi! I’m Ahsanul Haque, a graduate student majoring in marketing at Bangladesh University of Professionals. And I’m here to share what I learned about analytics tools and learn from you.