How to extend a trendline in Excel
Your company wants to compare this year’s sales revenue with the forecasted data. Based on the result, the company will predict next year’s data.
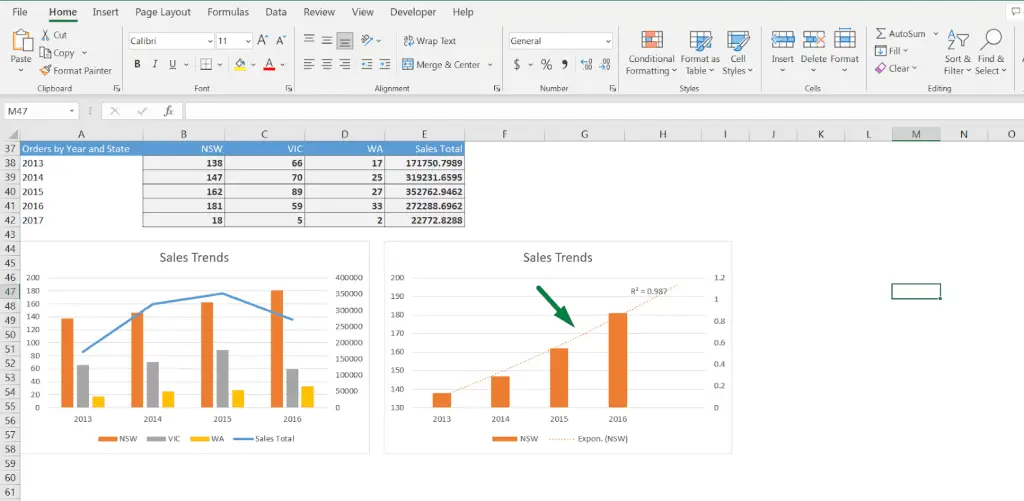
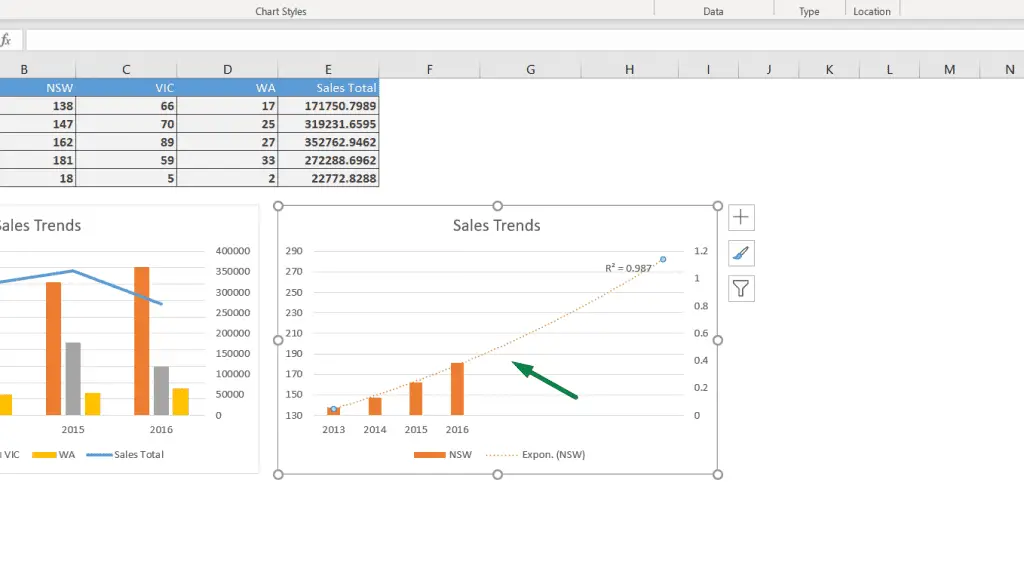
You already have a trendline, but now you want to extend it slightly. We have our data, which shows sales from 2013 to 2017.
Now, we already made a trendline with the sales data of a region. It shows a bar of 200 on the vertical axis. Now, we want to extend this trendline from 200 to 250, meaning we want to add more forecast periods by adding 50 more in value. How are you going to do it?
In this article, we will learn how to extend a trendline in Excel.
2 ways to extend a trendline in Excel
As we want to extend the trendline on the graph from the right side, we want to open the format option.
You can open the format option in 2 ways.
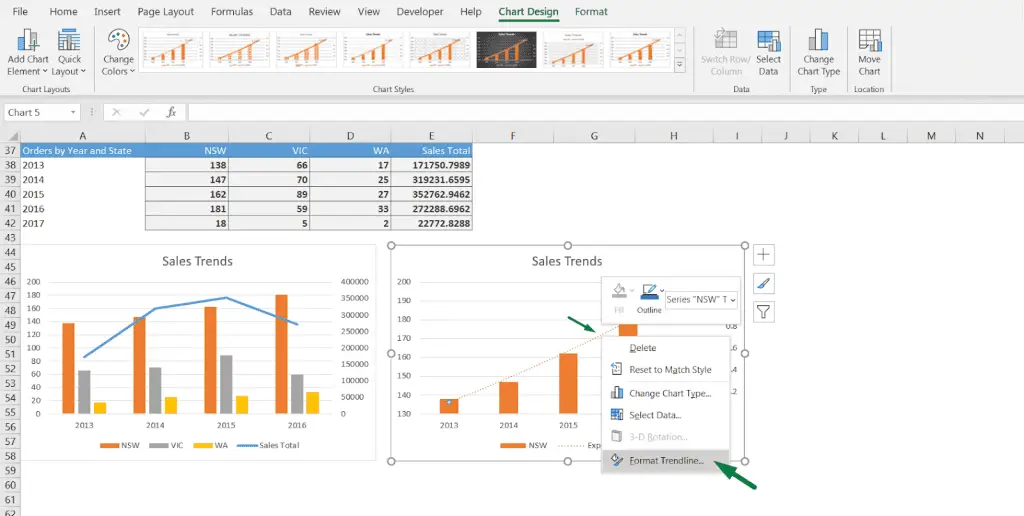
- Right-click on the trendline. This will open a box like this in the picture. At the bottom of that box, you will find an option named “Format trendline.” Click on that option to open the “Format Trendline” option.
- Or double-click on the trendline, which will also open the format option.
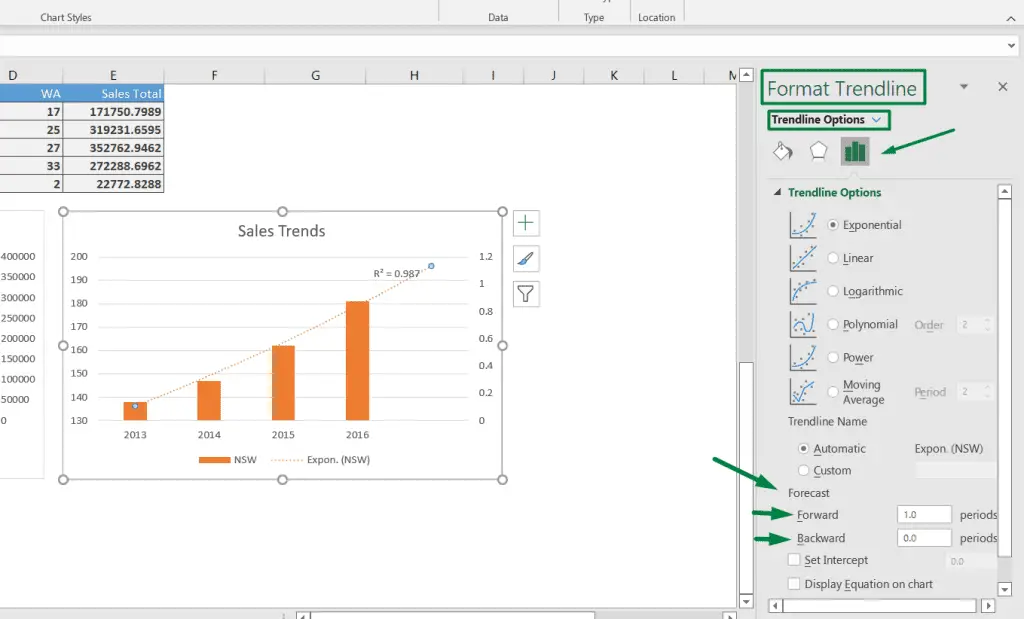
After opening the “Format Trendline” option, you will find 3 options: Fill and line, effects, and Trendline options. Go to the “Trendline options”. There, you will also find the options to format how you want to view your graph.
We can extend the data forward and even backward as we want to forecast the data.
We will learn how to extend a trendline in Excel forward.
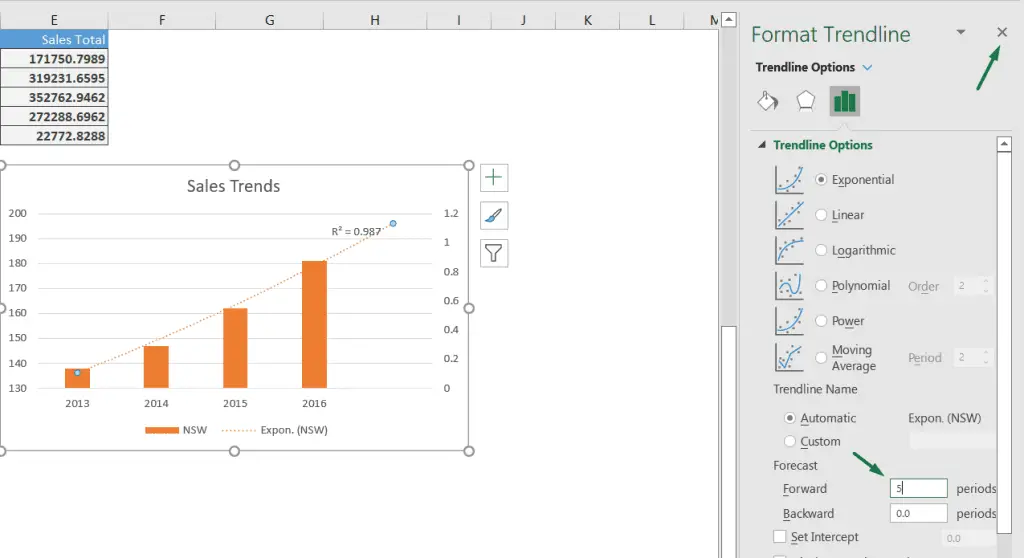
Go to the “Forecast” section. In the “Forward” option, under the forecast section, put 5 as we want to extend it by 50. You can set your number on how much you want to extend your graph.
After putting your value, click on the “cross sign” at the top right corner of that box.
After clicking the cross sign, Excel will automatically extend the trendline, as you can see.
That was easy, right?
If you want to extend a trendline in Excel backward, you can do it similarly.
Double-click or Right-click on the trendline. Select the “Format Trendline” option. Go to the backward option under the forecast section. Put your number on how far the value you want to extend backward. Click on the cross sign. It’s the same way as before.
You can easily extend a trendline in Excel forward or backward by putting your value with this method.
To summarize all that:
- Double click or Right click select the “Format Trendline” option > Go to the “Forecast” section. > Put your value in the “Forward” or “Backward” option > Click on the “Cross Sign” in the top right corner.
Now, you can extend your trendline in Excel and easily forecast any value.
Read More: How to add sigmoidal trendline in Excel.

Hi! I’m Ahsanul Haque, a graduate student majoring in marketing at Bangladesh University of Professionals. And I’m here to share what I learned about analytics tools and learn from you.