How to print chart in Excel [With Examples]
You can print a chart in Excel by selecting the chart, pressing “Ctrl + P,” and using the print button. But there are more customization options in the print that you might want to know. I personally prefer setting the settings for printing the chart.
Whether you want to put just a chart in your company presentation or data sharing, documentation, data analysis, collaboration, record-keeping, offline reference, or visual communication purposes, there are many times you might need to print a chart in Excel.
There are multiple ways how to print chart in Excel, such as;
- Using a shortcut
- From the “Home” ribbon
- And from the page layout ribbon
Let’s learn them one by one.
3 ways to print chart in Excel [Only the Chart]
As I already said, you will learn three different ways to print charts in Excel, and when I said chart, I meant you would learn how to print just the chart in Excel.
Yes, you can also print charts and data or tables, but let’s learn what we came to learn today.
Using the Shortcut
Printing a chart in Excel using a shortcut takes three simple steps and less than a minute.
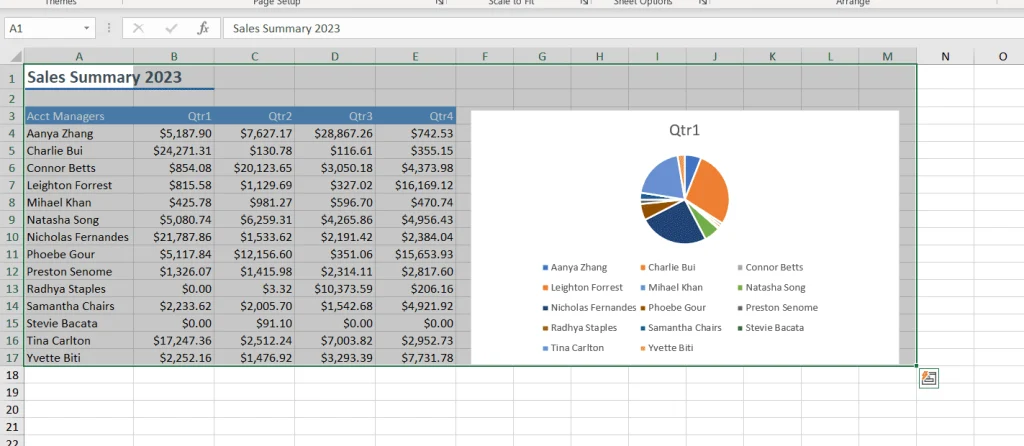
Here, we will learn with an example, such as how to print pie chart in Excel.
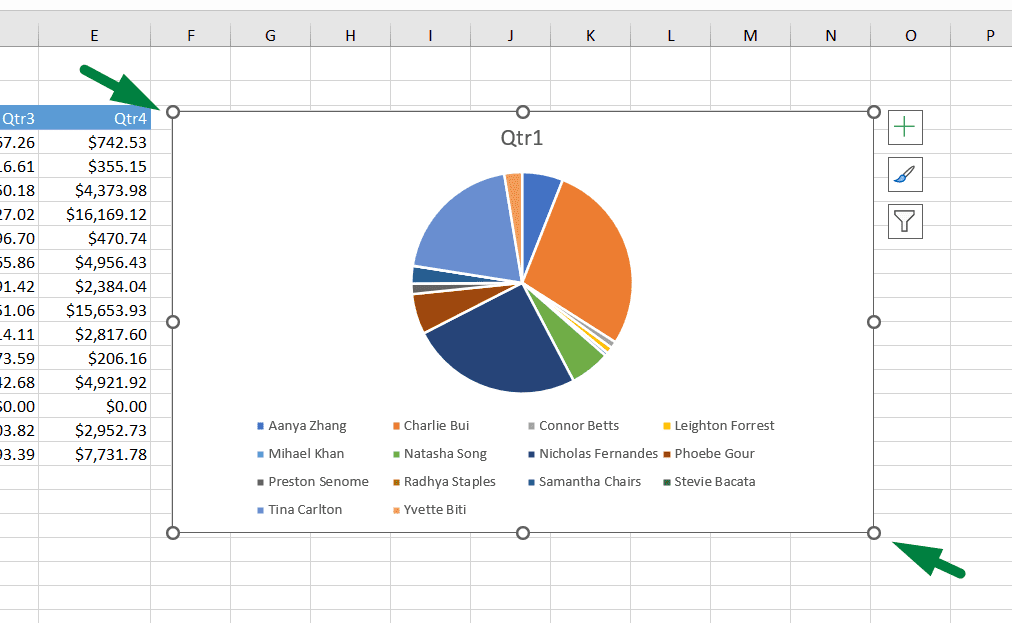
First, select the chart by clicking on it. The chart should now be highlighted, and you will see handles or white-colored rounds around it.
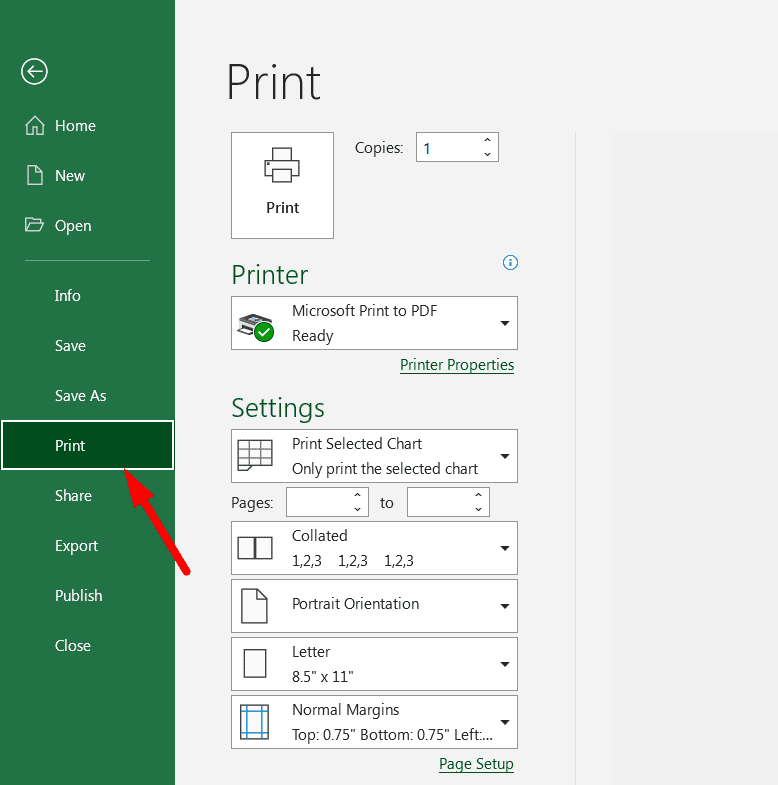
Then, press “Ctrl + P” to go to the print section to print settings and preview the pane.
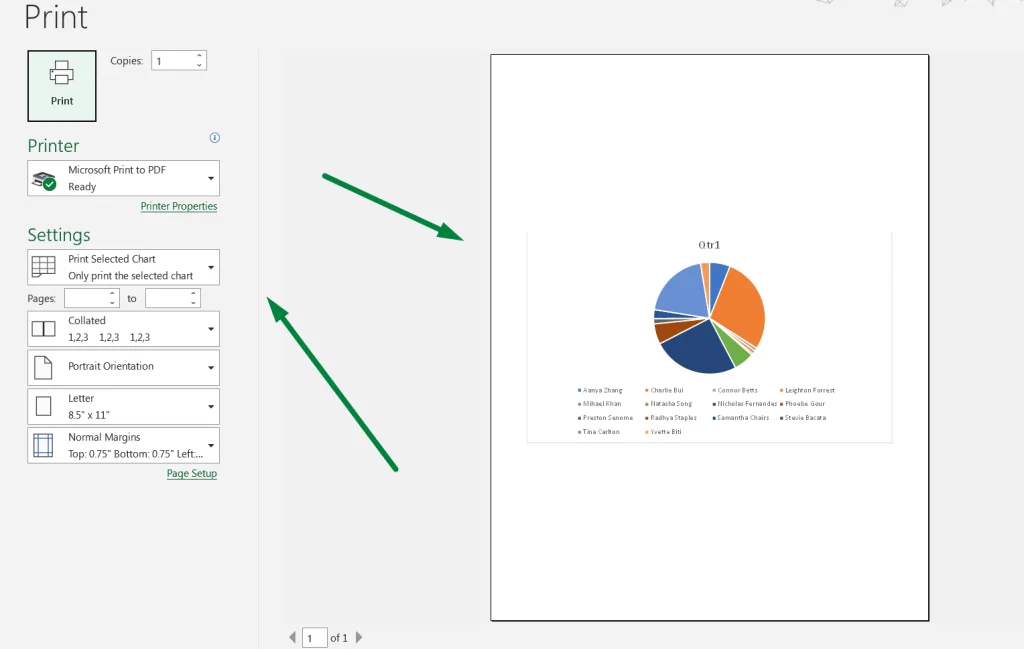
If you’re ok with the print settings, click the “Print” button, and the pie chart will be printed.
But, if you’re wondering, how do I print an Excel chart to pdf? Then, here’s how;
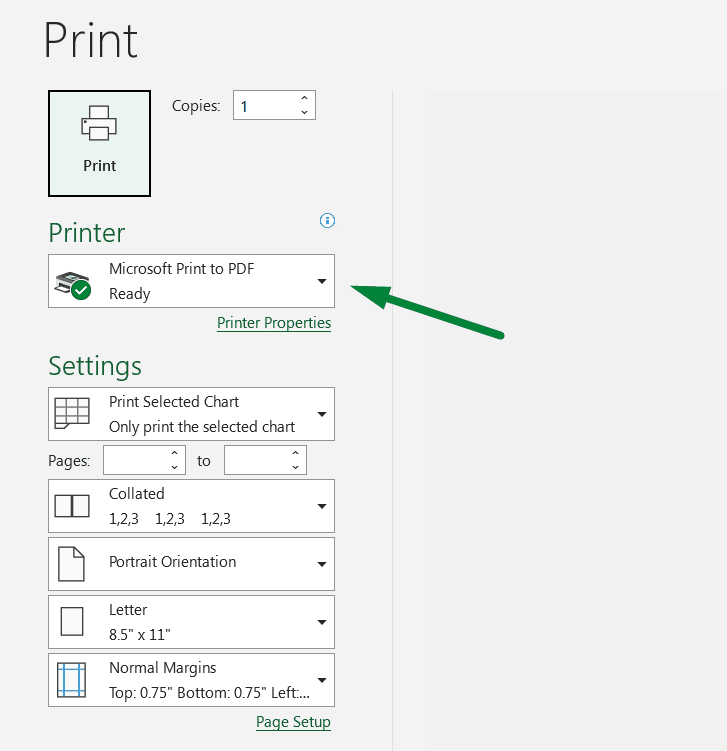
- Select “Microsoft Print to PDF” in the print settings and press print.
From the File Ribbon
You can also use the “File” ribbon to go to the print settings.
- Select the graph you want to print.
- Click on the “File” ribbon.
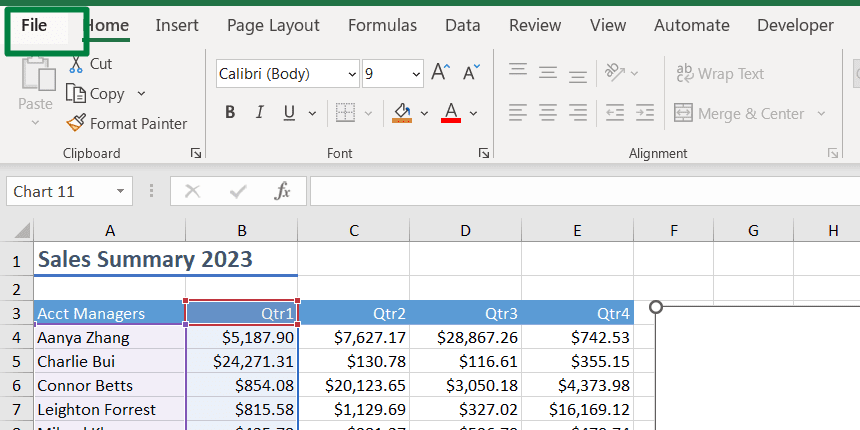
- After that, click on the print settings.
Or, you can use a hotkey, Alt + F + P + P, to print a chart in Excel.
And then, set your settings and print the graph you want to print.
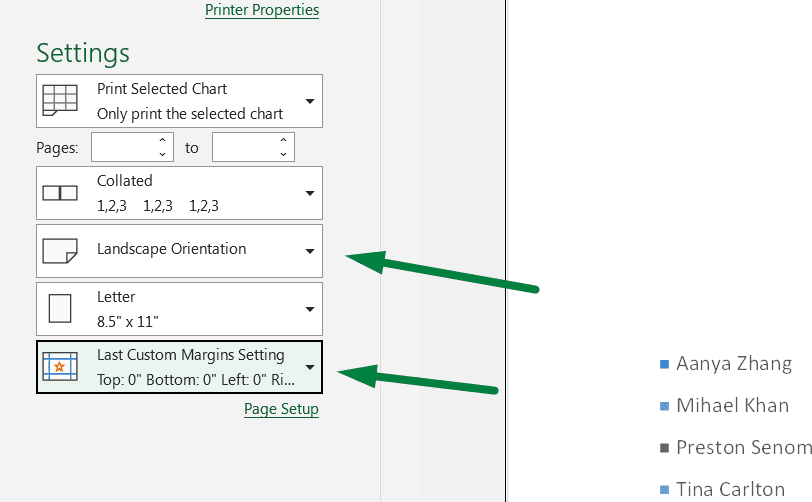
Again, if you’re wondering, how do I print an Excel chart on one page?
- From the print settings, change the orientation to “Landscape.”
- And click on the margins > Custom margins > and set everything to 0.
From the Page Layout Ribbon
You can also print a graph from the page layout ribbon.
- Select the chart.
- Go to the “Page Layout” ribbon.
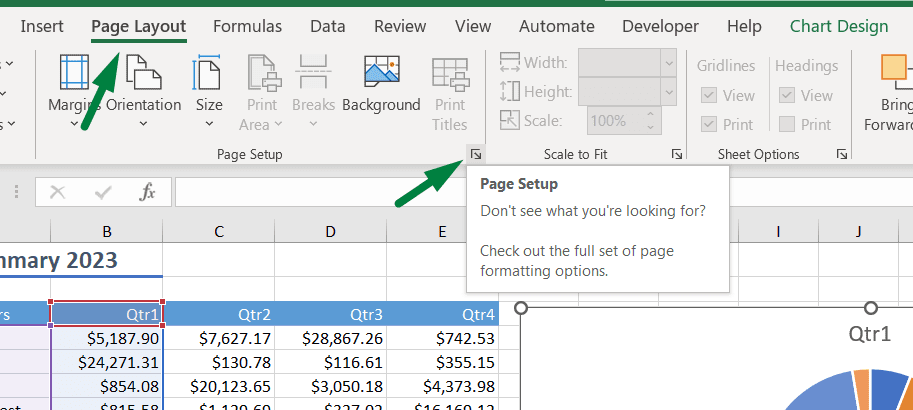
- At the bottom, there is an arrow sign shown in the image. Click on that, and it will take you to the chart settings, and from there, you can format and print your graph.
How to print graph and table in Excel
Sometimes, you might need to print the data/table and the graph. To do that,
- Select all cells that contain the data, along with the chart.
- Press Ctrl + P to go to the print settings.
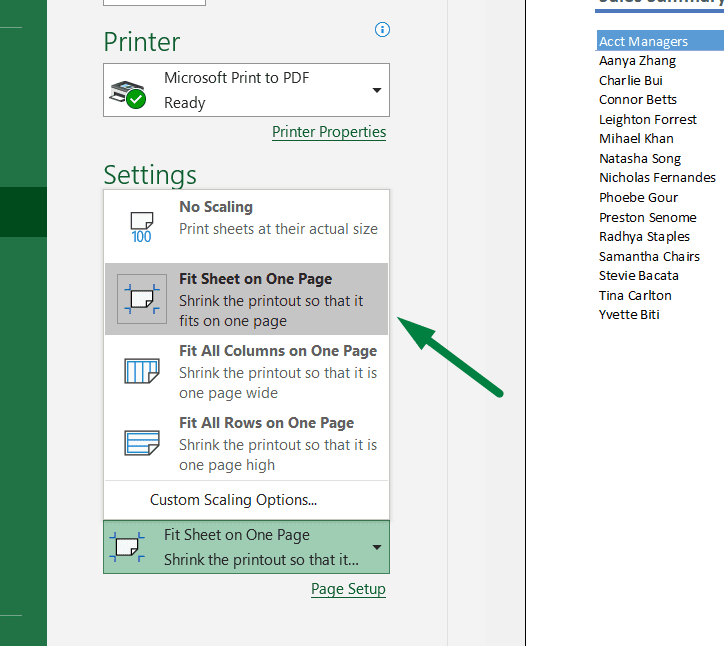
Sometimes, all the data and a graph might not fit all on one page. In that case, how to print a chart in Excel on one page?
- At the bottom, you will find some options. Select the “Fit Sheet on One Page” from them, and everything will fit on one page.
ShortCut / Keyboard Used
- To go to the print settings, Ctrl + P
- Print hotkey, Alt + F + P + P
Summary
You can print a chart in Excel in three ways: using a shortcut, from the file ribbon, and the page layout ribbon.
- Using the shortcut, Ctrl + P > click print.
- Click on the file ribbon > go to print settings > and print.
- Click on the page layout ribbon > click the arrow sign beside the “Page Setup” > go to print settings > and print.

Hi! I’m Ahsanul Haque, a graduate student majoring in marketing at Bangladesh University of Professionals. And I’m here to share what I learned about analytics tools and learn from you.