How to Add Alternative Text to a Chart in Excel
You can add alternative text to a chart in Excel by right-clicking on the chart, selecting the “View Alt Text” option, and then inserting the alt text for the chart. But there are two more ways to do it!
Most of us don’t use alt text in a graph in Excel. As it’s our work, we might understand what’s that. But, sometimes, that might confuse other co-workers or clients.
That’s why knowing how to add alternative text to a chart in Excel might be a great idea to let them know what the graph says or means. And you can add alternative text to chart Excel in three ways.
What is Meant by Alt Text?
Alt text is the short form of alternative text. When you add an alt text to an image or chart in any document, it should briefly describe the image or content.
The alt text is used for search engines to tell them what’s in that picture, graph, etc. That way, it understands better.
Besides, sometimes you might notice that the webpage doesn’t display the pictures if you have any network issues. But you might have seen a few texts in place of the photograph. That’s an alt text too.
Now, in excel, you can also add alternative text to a picture and graphs.
3 Ways to Add Alternative Text to Chart Excel
Let’s learn with pictures and examples. Here’s a pie chart for different types of customers.
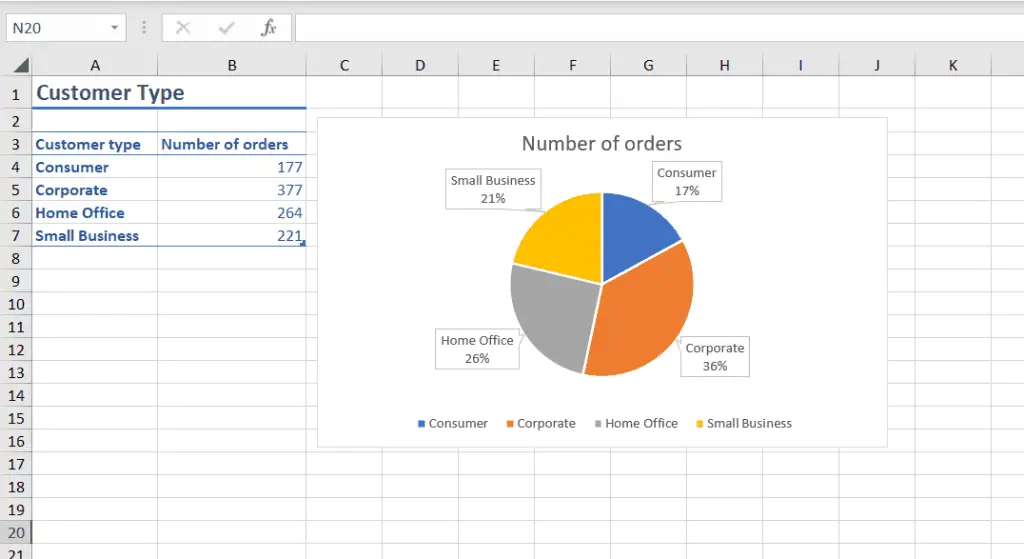
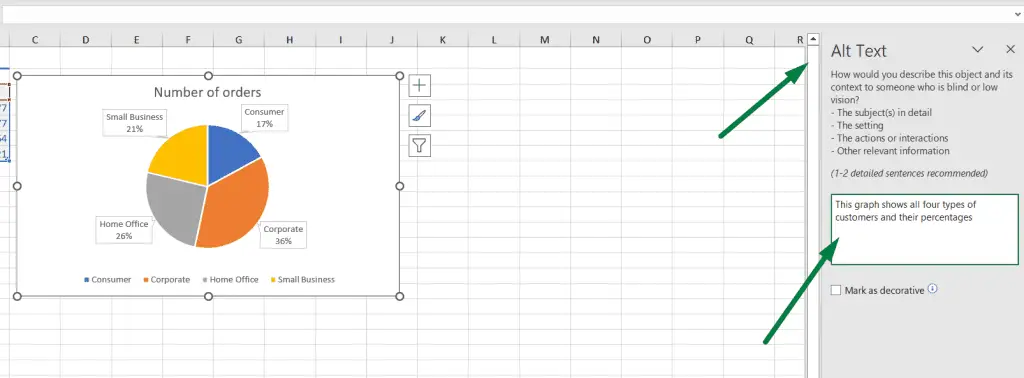
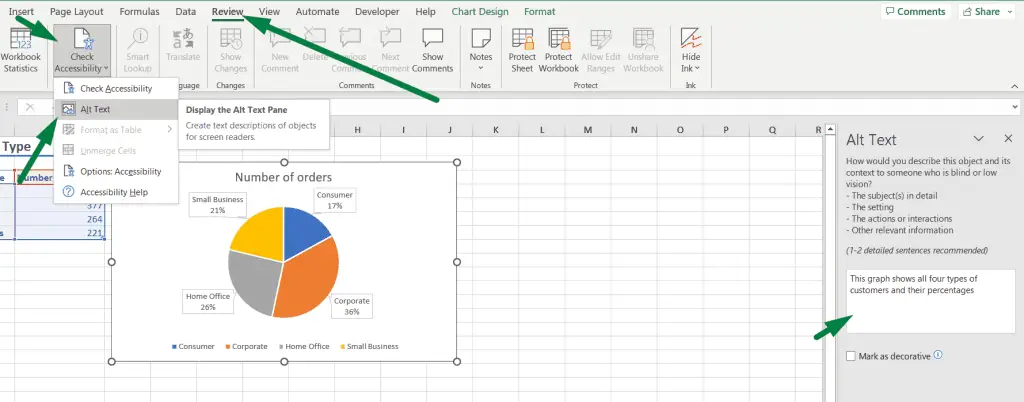
And we want to add alt text to this chart. For example, we want to add this text to this chart, “This graph shows all four types of customers and their percentages.”
We can add this alt text to the graph in three ways. Those are;
- Using right-click (The most straightforward way)
- From the format ribbon
- And from the review ribbon
Way #1: Using the Right-Click on the Mouse
To add alt this to this graph, move your mouse cursor above the chart area and right-click on the mouse.
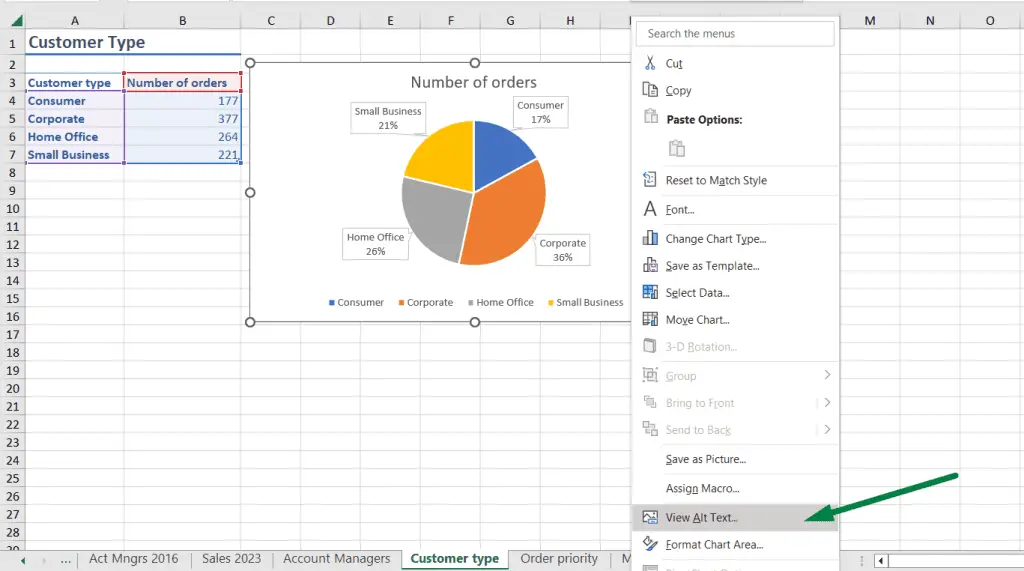
It will show you a list of options you can add, such as change chart type, move chart, etc. At the bottom, you will see the “View Alt Text” option; click on that.
Then, on the right side, a box named “Alt Text” will open, and you can put your text to describe that chart.
If you tick mark the “Mark as decorative” option, it means that the alt text is empty.
Way #2: From the Format Ribbon
You can also add alt text to the graph from the format ribbon. Click on the chart and go to the “Format” ribbon.
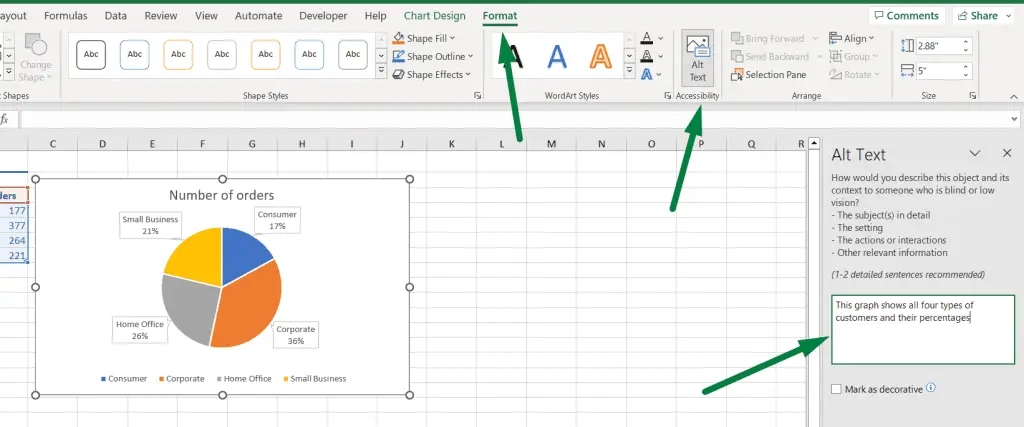
Under the accessibility section, click on the “Alt text,” and the box will open on the right side. Or press “Alt + JA + AT” to open.
Way #3: From the Review Ribbon
The accessibility section is also in the review ribbon.
- Click on the chart.
- Go to the “Review” ribbon.
- Click on the “Check Accessibility” drop-down menu.
- You will see the “Alt Text” option; click on that.
- And the alt text box will open.
Or you can press “Alt + R + A + L” to open the alt text.
Shortcut Used
The shortcuts to add alternative text to a chart in Excel are Alt + JA + AT or Alt + R + A + L.
Summary
You can add alt text to a graph in Excel in three ways;
- Right-click the chart > click the “View Alt Text” option > put your text.
- Click on the graph > go to the format ribbon > click on the “Alt Text” in the accessibility section.
- Click on the graph > go to the review ribbon > click on the “Check Accessibility” drop-down menu > Click on the “Alt text option.”

Hi! I’m Ahsanul Haque, a graduate student majoring in marketing at Bangladesh University of Professionals. And I’m here to share what I learned about analytics tools and learn from you.